
California Housing Market and Home Prices: What Official Data Shows
- See what a cash sale would net you
- Zero fees, zero commissions, zero closing costs
- No obligation — turn the offer down and owe us nothing
Want a Cash Offer on Your California Home?
Tell us about the property and get a written cash offer.
Last updated November 13, 2026. Reviewed by the Cash Home Buyers CA team. Figures come from the U.S. Census Bureau and the Federal Housing Finance Agency; sources are listed at the end.
California home prices were roughly flat over the year to the second quarter of 2026: the Federal Housing Finance Agency’s state index shows a 0.20% decline, ranking California 48th of 51 states and the District of Columbia. That is a sharp contrast with the 2.13% rise for the United States as a whole.
The Census Bureau puts the median value of an owner-occupied California home at $734,700. This guide explains what official data can and cannot tell you about your home’s price, and what a flat market means if you are deciding whether to list or sell for cash.
For a statewide look at sales, inventory and price cuts, see our California home price and sales report. This page focuses on the official price-index and Census figures behind it.
California housing market at a glance
| Median value of owner-occupied homes | $734,700 (Census ACS, 2020-2024) |
| Owner-occupied housing unit rate | 55.9% (Census ACS, 2020-2024) |
| Median monthly owner cost with a mortgage | $2,946 (Census ACS, 2020-2024) |
| Median gross rent | $2,036 (Census ACS, 2020-2024) |
| Median household income | $99,122 in 2024 dollars (Census ACS, 2020-2024) |
| Housing units | 14,995,410 as of July 1, 2025 (Census estimate) |
| Building permits | 103,856 in 2025 (Census) |
| FHFA price change, one year | -0.20% (second quarter 2026) |
| FHFA price change, five years | +17.31% |
| FHFA price change since 1991 | +317.15% |
The Census median value is the owner’s own estimate across 2020 to 2024 survey responses, so it lags the current market. It describes the typical owner-occupied home, not the price of a recent sale.
What the FHFA index says about price direction
The FHFA House Price Index tracks repeat sales and refinancings of the same single-family homes, so it measures how prices move rather than what a typical home costs. For California, the one-quarter change to the second quarter of 2026 was -0.62%, the one-year change was -0.20%, and the five-year change was 17.31%. The Pacific census division, which includes California, Oregon, Washington, Alaska and Hawaii, was close to flat at 0.02% over the year.
Longer term the picture is different: the index is up 317.15% since 1991. A flat year after a large run-up is why many owners still hold substantial equity even when the market is soft.
Metro areas differ widely
FHFA also publishes metro-level indexes. Year-over-year changes for the second quarter of 2026 for California metros include:
| Anaheim-Santa Ana-Irvine | +3.35% |
| San Diego-Chula Vista-Carlsbad | +2.49% |
| Fresno | +2.05% |
| Los Angeles-Long Beach-Glendale | +1.20% |
| Riverside-San Bernardino-Ontario | +0.83% |
| Bakersfield-Delano | +0.47% |
| Sacramento-Roseville-Folsom | +0.08% |
| San Francisco-San Mateo-Redwood City | -0.28% |
| San Jose-Sunnyvale-Santa Clara | -0.98% |
| Stockton-Lodi | -1.75% |
| Oakland-Fremont-Berkeley | -4.80% |
Southern California metros were up, while several Bay Area and Central Valley metros were down. Your own street can move differently from its metro, which is why a local figure matters more than any statewide average. Our place pages cover Los Angeles, San Diego, San Jose, San Francisco, Sacramento, Fresno, Bakersfield, Riverside and Oakland.
Affordability: prices against incomes
With a $734,700 median home value and a $99,122 median household income, the typical California home is worth about 7.4 times the typical household’s yearly income. That ratio is our own arithmetic from the two Census figures, and it mixes a home-value estimate with an income figure from the same survey period.
It is a rough guide, not an official affordability index. Owners with a mortgage pay a median of $2,946 a month in selected owner costs, compared with $2,036 median gross rent, which helps explain why many buyers wait and why homes can sit longer when mortgage rates are high.
Our housing affordability report goes deeper on this, and the rate lock-in report covers why some owners are not listing.
Supply: how many homes are being built
The Census counts 14,995,410 housing units in California as of July 1, 2025, and recorded 103,856 building permits during 2025. Permits are a count of authorized units, not completed homes. The state’s population estimate for July 2025 was 39,355,309, about half a percent below the 2020 estimates base, so demand pressure is not coming from rapid population growth. See our stale listings and price cuts report for how long homes are taking to sell.
What a flat market means for sellers
- Price is set by your neighborhood. Use recorded sales near you, not a statewide median, to judge value.
- Time and carrying costs matter more. In a flat market, months of mortgage, taxes and insurance can cancel a higher list price.
- Equity is often large. The index is up more than 17% in five years, so many owners have gains. Review the capital gains guide and the Prop 13 reassessment guide before you sell.
- Net beats price. Compare what you keep after commission, repairs and closing costs, using our seller closing costs guide.
How to sell a house in California in a flat market
- Pull recent nearby sales. Check the county recorder and your city for comparable sales from the last few months.
- Get a payoff statement. Know your loan balance so you can see your equity.
- Price the work. Get quotes for repairs a traditional buyer would ask for.
- Compare routes. A listing may bring a higher price but takes time, showings and concessions. A cash sale is faster and sold as-is.
- Pick a closing date. Cash sales can close on your timeline, often within days or weeks.
See where we buy houses across California.
Want to know what a cash sale would net you? Call (424) 435-2326 or request a cash offer. There is no cost and no obligation.
California housing market FAQ
Are California home prices going down?
The FHFA state index fell 0.20% over the year to the second quarter of 2026, and 0.62% in the quarter. Over five years it is up 17.31%.
What is the median home value in California?
The Census Bureau reports $734,700 as the median value of owner-occupied housing units for 2020-2024. It is a survey estimate and lags current sales prices.
Is the FHFA index the same as the median sale price?
No. It measures price changes for repeat sales of the same homes, not the price of a typical sale.
Do prices move the same everywhere in California?
No. For the year to the second quarter of 2026, FHFA shows Anaheim-Santa Ana-Irvine up 3.35% and Oakland-Fremont-Berkeley down 4.80%.
Can I sell my house for cash if the market is flat?
Yes. A cash sale does not depend on a buyer’s mortgage approval or an appraisal. We make written cash offers with no commissions or closing costs charged to the seller.
Sources
- Federal Housing Finance Agency: House Price Index datasets and state and metro summary tables
- U.S. Census Bureau: QuickFacts, California
- California Department of Finance: E-5 Population and Housing Estimates
This guide is general information, not financial or legal advice. Index changes describe past prices and do not predict your home’s sale price.
From the Blog
Latest guides for California home sellers
-
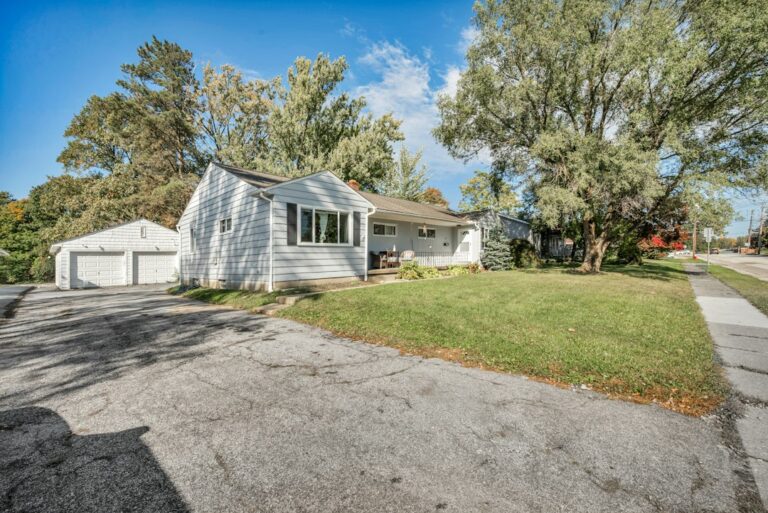
California’s Judicial Foreclosure Redemption Right: The One-Year Window Most Owners Never Hear About
California's rarer judicial foreclosure process comes with a statutory right to redeem the property for up to a year after the sale…
Read the guide → -
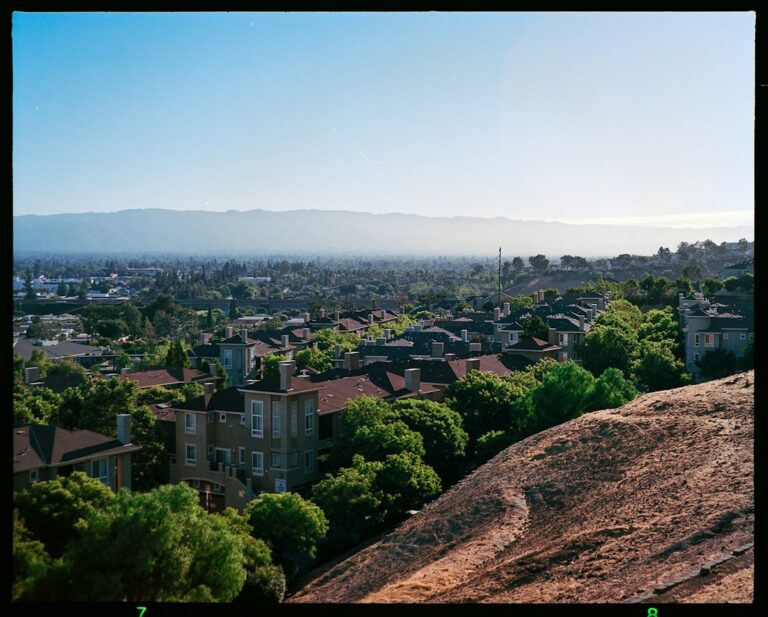
Santa Clara County’s Tax-Defaulted Property Auction: How to Claim the Excess Proceeds
When a Santa Clara County home isn't redeemed within the state's deadline, the county can sell it at public auction — and…
Read the guide → -
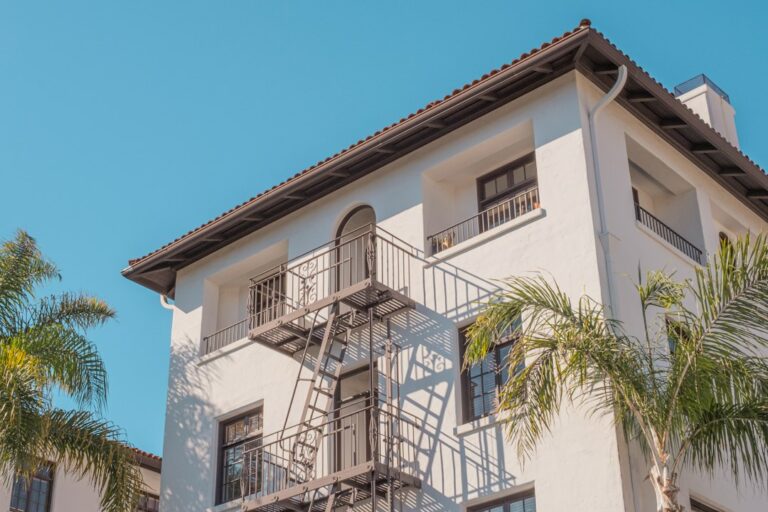
Pomona’s Rent Stabilization Ordinance Just Became Permanent: What Landlords Must Do Before Selling
Pomona's Ordinance No. 4359 became permanent on January 1, 2026, replacing the city's prior urgency ordinances and capping most rent increases at…
Read the guide → -
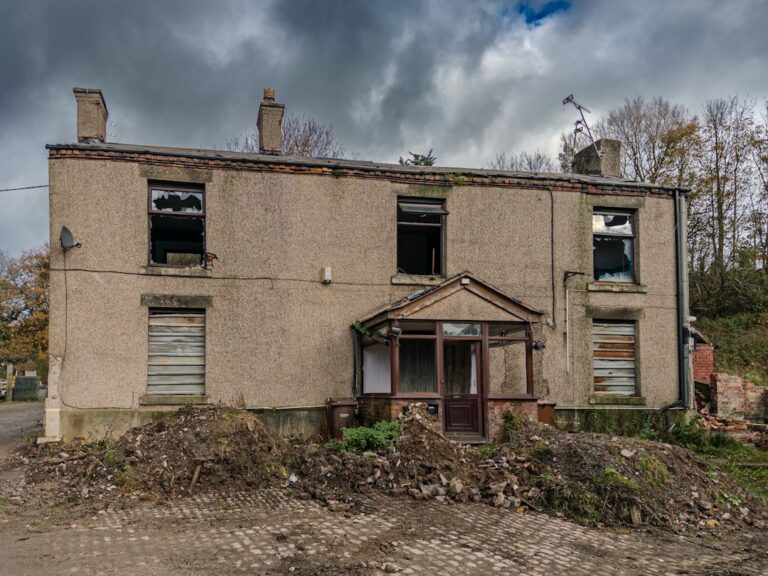
Compton’s Substandard Building Ordinance, Explained
Compton can order a dangerous or substandard house secured, repaired, or demolished under Municipal Code Chapter 14, and if the owner misses…
Read the guide → -

Chico’s RECO Inspection: What Sellers of Older Homes Must Fix Before Closing
Chico requires sellers of homes built before July 1, 1991 to pass a RECO energy and water retrofit inspection — or transfer…
Read the guide → -
Emeryville’s Just Cause Eviction Ordinance: Relocation Pay Under Municipal Code 5-40
Emeryville had its own just-cause eviction and relocation-assistance ordinance years before California’s statewide AB 1482 existed, and the local rule is still…
Read the guide → -

Malibu’s Six-Year Rebuild Deadline After the Palisades Fire: Municipal Code 17.60.020(C)
Malibu homeowners rebuilding after the January 2025 Palisades Fire have a hard deadline most residents outside the city have never heard of:…
Read the guide → -
California’s Security Deposit Cap: How AB 12 Limits What Landlords Can Collect
AB 12 caps most California security deposits at one month's rent, with a narrow exception for small landlords — plus new 2025…
Read the guide → -
California Civil Code §4525: The 11 HOA Documents You Must Hand a Buyer Before Closing
California Civil Code §4525 requires sellers inside an HOA to hand buyers 11 specific documents before closing — a list that just…
Read the guide →